Knife Crime in England: 2024 Statistics, Hotspots, and Regional Insights

Knife crime is an issue that affects communities across England, from busy cities to quieter towns. According to the latest government data, nearly 50,000 serious knife offences were recorded between July 2023 and June 2024—a troubling figure that highlights the gravity of the problem.
But where is knife crime in England most prevalent? And where is it on the rise? To better understand this issue, we’ve analysed government data to identify the areas most affected by knife crime. Our findings highlight the police force areas with the highest number of serious knife offences, the regions experiencing the largest increases in knife crime over the last five years, and the local authorities with the highest rates of possession of weapon offences.
Key Knife Crime Statistics at a Glance
- Nearly 50,000 serious knife crimes were recorded in England from July 2023 to June 2024.
- London has the highest rate of serious knife crimes, at 17.89 offences per 10,000 people.
- Cleveland, in the North East, ranks second with 14.02 offences per 10,000 people.
- South Yorkshire ranks third with 10.72 offences per 10,000 people.
- While knife crime in England has decreased by 8.23% over the past five years, some areas, such as the City of London, have seen significant increases.
Police Force Areas with the Highest Number of Serious Knife Crimes
Serious knife crimes include attempted murder, threats to kill, assault with injury, assault with intent, robbery, rape and sexual assault, and homicide. Below, we highlight the police force areas with the highest total of serious knife crimes, as well as the locations leading in each specific offence type.
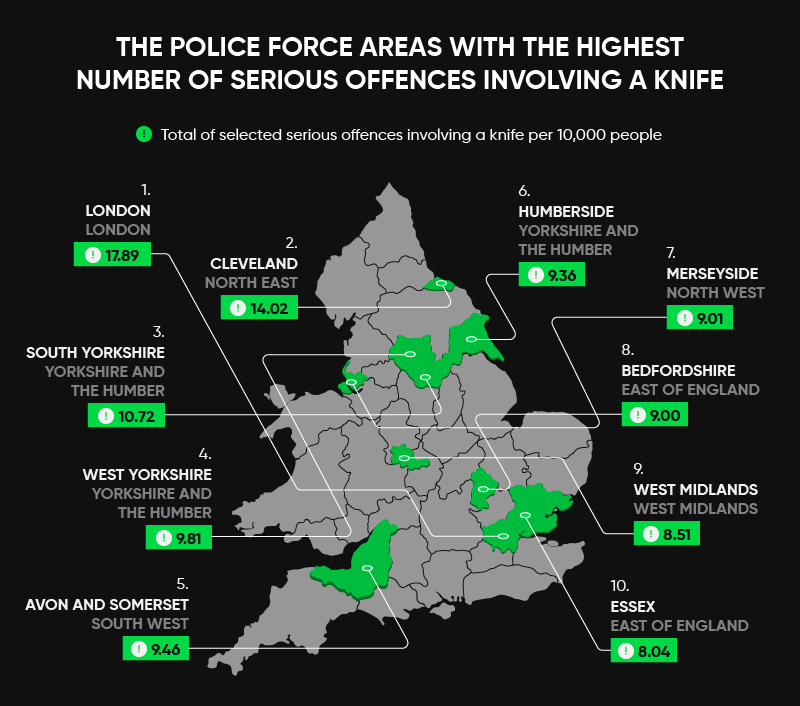
- London Knife Crime Statistics
- Knife crime rate: 17.89 offences per 10,000 people.
- Total incidents: 15,859.
- Cleveland: A Knife Crime Hotspot in the North East
- Knife crime rate: 14.02 offences per 10,000 people
- Key offences: Highest rate of knife-related assaults (8.61 per 10,000 people)
- South Yorkshire, Yorkshire and The Humber
- Knife crime rate: 10.72 offences per 10,000 people
- Key offences: Ranked third for robberies and assaults involving knives
The London knife crime statistics show that the capital has the highest rate of serious knife crimes in England. With 17.89 serious offences involving a knife per 10,000 residents, London recorded the highest knife crime rate in the country. The capital also led the UK in knife-related robberies, with a rate of 11.07 per 10,000 people, and reported the third-highest homicide rate involving knives, at 0.07 per 10,000 people.
The scale of London knife crime statistics is staggering, with total incidents being three times higher than any other police force area. The City of London has also recorded a steady rise in violent crime over the past five years.
Cleveland ranks second for serious knife crime statistics in the UK, with a knife crime rate of 14.02 per 10,000 people. The area recorded the highest number of knife-related assaults, including assaults with intent to cause serious harm, at 8.61 per 10,000 people. Cleveland also ranked second for knife-related robberies, attempted murders, and homicides.
Research suggests a connection between crime rates and social deprivation, as Cleveland faces challenges such as high unemployment, low education levels, and substance abuse. Drug dependency, in particular, has been identified as a significant factor contributing to violent crime in the region. To better understand how drug misuse impacts crime rates across the UK, explore our UK Drug Misuse Report 2024, which highlights trends in substance abuse and its wider societal effects.
South Yorkshire reported the third-highest knife crime rate in England, with 10.72 offences per 10,000 people. It also ranked third for attempted murders, knife-related assaults, robberies, and homicides involving a knife.
Knife-related crime has remained a significant issue in South Yorkshire in recent years. Between March 2021 and March 2022, the area saw an average of four knife-related offences per day. Among the weapons used, knives or daggers accounted for 42% of cases, followed by kitchen knives at 19%.
Police Force Areas with the Most Attempted Murder Offences Involving a Knife
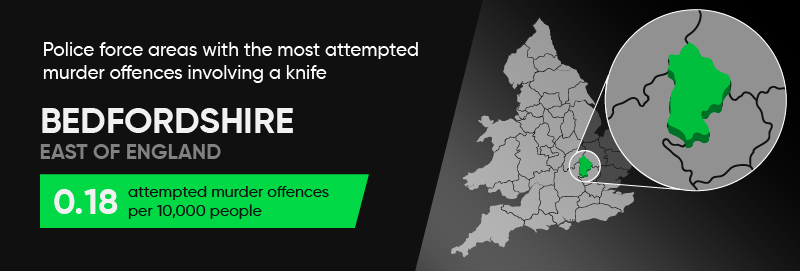
Bedfordshire reported the highest rate of knife-related attempted murders in England, at 0.18 offences per 10,000 people. This police force area recorded 13 incidents, ranking it ninth in total numbers across the country. Cleveland and South Yorkshire followed closely, with rates of 0.16 and 0.14 per 10,000 people, respectively.
Police Force Areas with the Most Threats to Kill Offences Involving a Knife
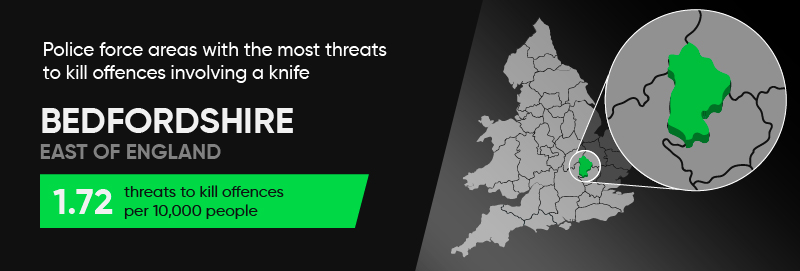
Bedfordshire also has the highest rate of threats to kill offences involving a knife in England, with 1.72 offences per 10,000 people. Between July 2023 and June 2024, Bedfordshire recorded 123 threats to kill involving a knife, ranking highest in rate despite being 14th in total incidents. West Yorkshire and Humberside followed, with rates of 1.56 and 1.42 per 10,000 people, respectively.
Police Force Areas with the Most Assault with Injury and Assault with Intent to Cause Harm Offences Involving a Knife
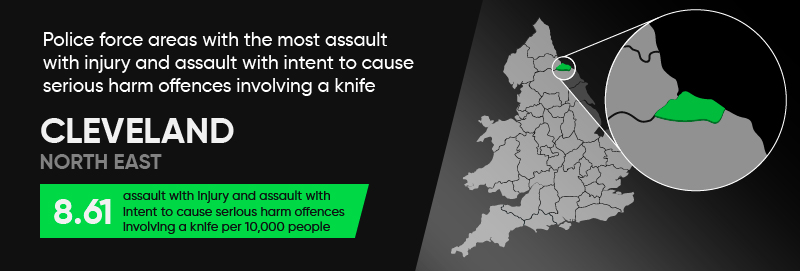
Cleveland, in the North East, recorded the highest rate of assault involving knives, with 8.61 incidents per 10,000 people. The total number of offences in this category approached 500. Merseyside (5.37 per 10,000 people) and South Yorkshire (5.19 per 10,000 people) ranked second and third, respectively.
Police Force Areas with the Most Robbery Offences Involving a Knife
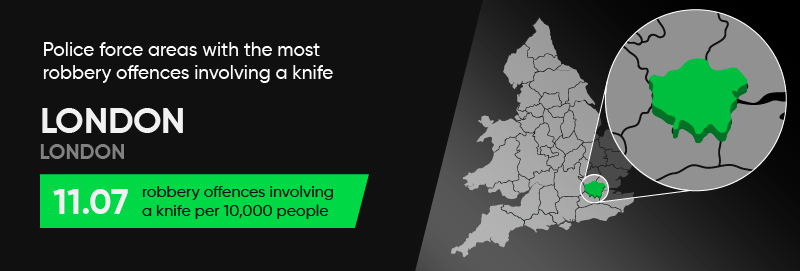
London leads in knife-related robberies in England, with a rate of 11.07 offences per 10,000 people—four times higher than any other police force area. Cleveland and South Yorkshire followed, with robbery rates of 4.28 and 4.27 per 10,000 people.
Police Force Areas with the Most Rape and Sexual Assault Offences Involving a Knife
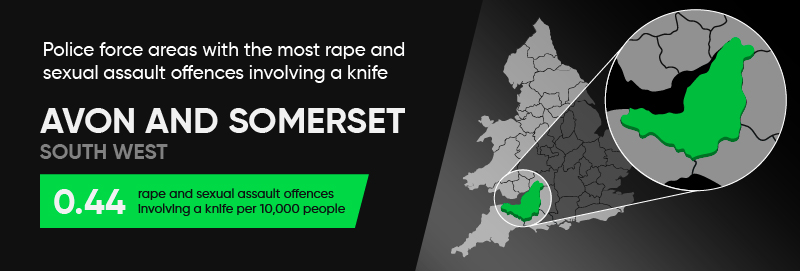
Avon and Somerset recorded the highest rate of knife-related rape and sexual assault offences in England, at 0.44 per 10,000 people. Essex and Humberside ranked next, with rates of 0.38 and 0.32, respectively.
Police Force Areas with the Most Homicide Offences Involving a Knife
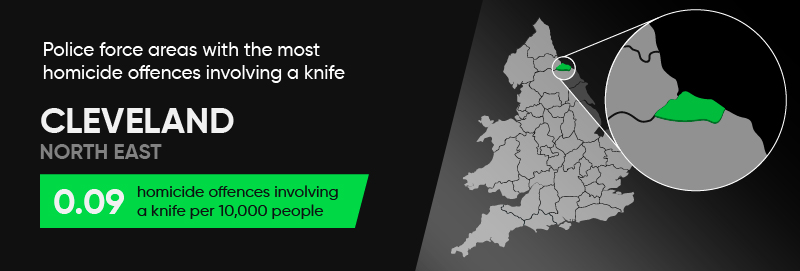
Cleveland recorded the highest rate of knife-related homicide offences in England, with 0.09 offences per 10,000 people. Avon and Somerset and London followed in second place, each recording a rate of 0.08 offences per 10,000 people.
Knife Crime Trends Over the Last Five Years
While knife crime in England has decreased by 8.23% over the past five years, dropping from 53,000 incidents in 2019/2020 to just under 49,000 in 2023/2024, some areas have experienced significant increases. Kent saw the largest decrease, with a 40% reduction in knife crime. However, this trend hasn’t been consistent nationwide. Below are the police force areas where knife crime has risen the most.
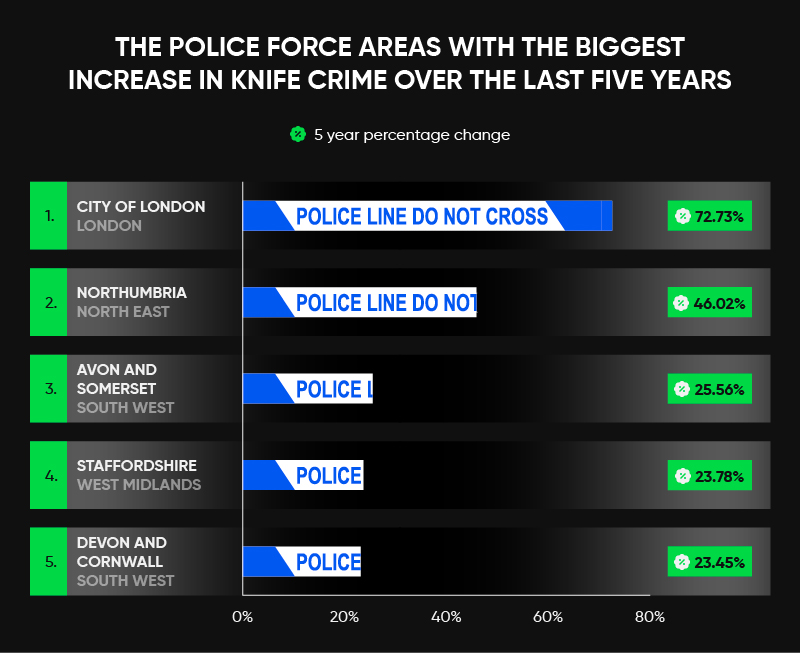
- City of London, London
- Northumbria, North East
- Avon and Somerset, South West
72.73% increase in knife crime over five years
The City of London has seen the sharpest rise in knife crime, with a staggering 72.73% increase over the past five years. This area also recorded the largest year-on-year increase of any police force area. Between April 2021 and March 2022 alone, knife crime rose by 192.86%. Over the past 12 months, incidents have continued to climb, with a further 40% increase.
46.02% increase in knife crime over five years
Northumbria takes second place, with knife crime rising by 46.02% in the last five years. The number of serious knife-related crimes in Northumbria grew from 791 in 2020 to 1,155 by June 2024. This equates to a rate of 7.88 serious knife crimes per 10,000 people, ranking 12th among police force areas. The most prevalent knife crime in Northumbria was assault with injury and intent to cause serious harm, with 4.33 incidents per 10,000 people.
25.56% increase in knife crime over five years
Avon and Somerset recorded a 25.56% increase in knife crime, placing it third on the list. Knife-related incidents rose from 1,330 in 2019/2020 to 1,670 between July 2022 and June 2024. This area reported the fifth-highest rate of serious knife crimes in England, at 9.46 per 10,000 people.
Additionally, Avon and Somerset had the highest rate of rape and sexual assault offences involving a knife, with 0.44 incidents per 10,000 people, further highlighting the severity of the issue in this area.
These regional disparities highlight the complex nature of crime trends across the UK. For a more comprehensive view of crime patterns beyond knife offences, including other types of violent and non-violent crimes, check out our UK Crime Report 2024. This report provides detailed insights into crime rates, hotspots, and trends nationwide, helping to paint a broader picture of the challenges faced by communities across the country.
Local Authorities with the Most Possession of Weapon Offences
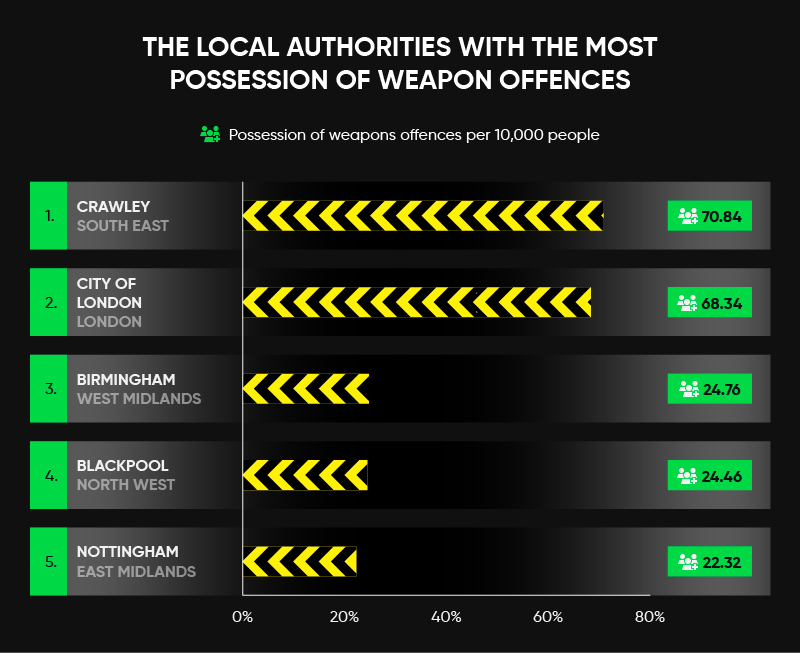
Over the last year, more than 50,000 possession of weapons offences were recorded across England and Wales, averaging 9.31 offences per 10,000 people. The figures below highlight the local authorities with the highest rates of possession offences, significantly exceeding the national average.
- Crawley
- City of London
- Birmingham
70.84 possession of weapon offences per 10,000 people
Crawley takes the top spot, with a possession offence rate of 70.84 per 10,000 people. In total, 854 possession of weapon offences were recorded in Crawley, the fifth-highest total in England despite its smaller population.
68.34 possession of weapon offences per 10,000 people
The City of London comes in second, with 68.34 possession of weapon offences per 10,000 people. While it has the second smallest population of any local authority, the City of London recorded more possession offences than over 100 other local authorities, with a total of 92 incidents.
24.76 possession of weapon offences per 10,000 people
Birmingham completes the top three, with a rate of 24.76 possession offences per 10,000 people. In total, Birmingham recorded nearly 3,000 offences, making it the local authority with the highest total number of possession offences. This was more than double the figure reported in Manchester, which recorded 1,280 offences.
The Worst Police Force Areas for Knife Crime by Region
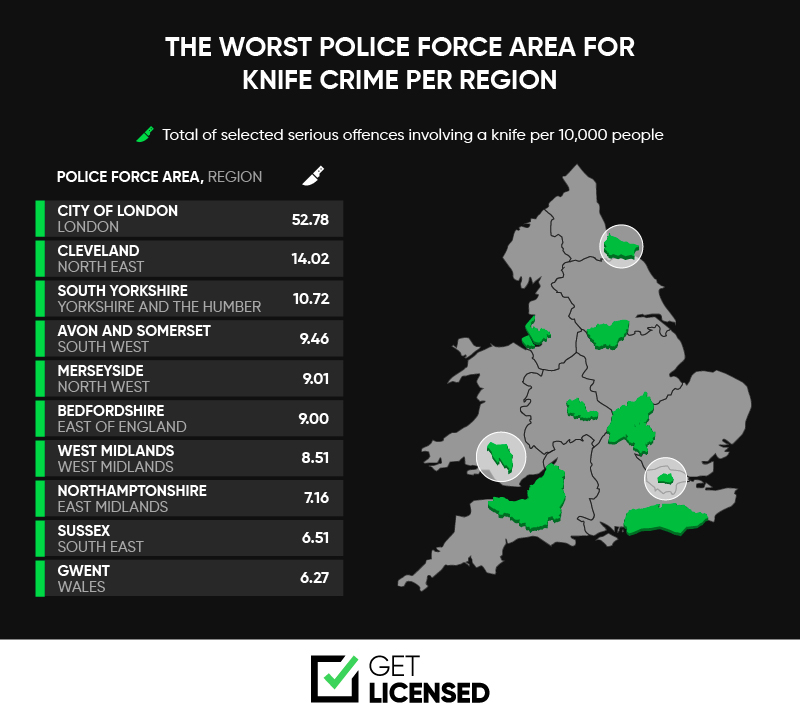
Below, we highlight the worst police force areas in each region for serious offences involving a knife.
- London, City of London
- North East, Cleveland
- Yorkshire and the Humber, South Yorkshire
52.78 serious knife crimes per 10,000 people
London recorded the highest rate of serious knife crimes in the UK, with the City of London leading the region at 52.78 offences per 10,000 people. This makes it the most dangerous police force area for knife crime in the country. Some experts and politicians have suggested that a lack of police funding over the last decade has contributed to the rise in violent crime, including knife-related offences.
14.02 serious knife crimes per 10,000 people
The North East ranks as the second-worst region for serious knife crimes, with Cleveland recording 14.02 offences per 10,000 people. According to Detective Chief Inspector Stuart Hodgson of Cleveland Police, around a third of serious violent offences in the area involve young people under the age of 24.
10.72 serious knife crimes per 10,000 people
Yorkshire and the Humber is the third-worst region for serious knife offences, with South Yorkshire reporting 10.72 knife crimes per 10,000 people. Within South Yorkshire, Sheffield is the most dangerous city, with a crime rate of 91 offences per 1,000 people. In 2020, the city saw nearly 10 people hospitalised daily due to violent attacks.
The Role of the SIA in Combating Knife Crime
With Cleveland, London, and South Yorkshire topping the charts for serious knife crime in the UK, the role of well-trained security professionals is more important than ever. The Security Industry Authority (SIA) plays a key part in regulating and overseeing the training and licensing of security professionals, ensuring they are equipped to respond effectively to such challenges.
Security officers are often the first line of defence in many public and private spaces, from shopping centres and nightlife venues to transport hubs. Proper SIA-approved training helps security professionals develop the skills needed to manage potentially violent situations, deter crime, and support law enforcement. This training includes conflict management, risk assessment, and spotting early signs of trouble—all of which can help reduce the likelihood of knife-related incidents.
How Get Licensed is Making a Difference
At Get Licensed, we are proud to contribute to this effort by offering high-quality, SIA-approved training for aspiring security professionals. Through our security training courses, candidates not only meet the legal requirements for obtaining their SIA licence but also gain practical skills to help create safer environments for everyone.
By training more skilled and confident security personnel, we’re helping to address the root causes of violent crime, such as anti-social behaviour, and empowering individuals to play an active role in making their communities safer.
Conclusion
Knife crime in the UK remains a critical issue, particularly in regions such as the City of London, Cleveland, and South Yorkshire continuing to face high rates of violent offences. While overall knife crime has decreased by 8.23% over the last five years, certain offences—such as knife-related robberies in London—are on the rise.
These trends highlight the urgent need for effective measures to address knife crime and ensure public safety. Security professionals play a crucial role in this effort. From patrolling high-risk areas to managing safety in public spaces, their presence helps deter crime and protect communities. Through SIA-approved training, organisations like Get Licensed empower security personnel with the skills needed to assess risks, handle conflict, and respond to threats effectively.
A comprehensive approach is essential to combat knife crime. By combining law enforcement, community initiatives, and the expertise of trained security officers, we can create safer environments and reduce the impact of violent crime across England.
Methodology
This report is based on data sourced from the Office for National Statistics (ONS), which provides detailed records of knife crime incidents across police force areas in England and Wales. The following categories of knife crime were analysed:
- Attempted murder offences involving a knife
- Threats to kill offences involving a knife
- Assault with injury and assault with intent to cause serious harm offences involving a knife
- Robbery offences involving a knife
- Rape and sexual assault offences involving a knife
- Homicide offences involving a knife
Using population figures from the ONS dataset, we calculated the rate of each type of knife crime per 10,000 people.
To present a comprehensive overview for London, data from the City of London and the Metropolitan Police areas were combined to produce a single figure.
Additionally, we calculated year-on-year changes in knife crime rates for each area, as well as the percentage change over the last five years, which was used to rank police force areas by the scale of increase or decrease.
For possession of weapon offences, we utilised ONS crime data to determine the total number of incidents per local authority. This was then paired with ONS’s population data to calculate the rate of offences per 10,000 people.
Launch your career as a
Security Guard in the UK
Learn how to start your career in UK security industry.
Explore Courses

 Trustpilot


