Get Licensed's Crime Report 2024
From petty theft to serious violent crimes, crime rates in England and Wales have generally fallen in recent years. But these numbers tell only part of the story—crime rates vary widely depending on the region, the season, and even the month. Social, economic, and environmental factors all play a role in shaping these trends.
Building on our previous analysis of the UK’s Crime Capitals and Most Violent Cities, the Get Licensed team has dug deeper into the data to explore how crime patterns shift across England and Wales. We’ve examined everything from crime hotspots to the types of offences that spike at certain times of year, revealing the hidden rhythms of crime and the factors that make some regions more vulnerable than others.
How Does Crime Fluctuate Throughout the Year?
Crime levels don’t stay the same all year round. Below, we’ve calculated the average number of crimes that occurred each month, covering data from May 2013 to July 2024.
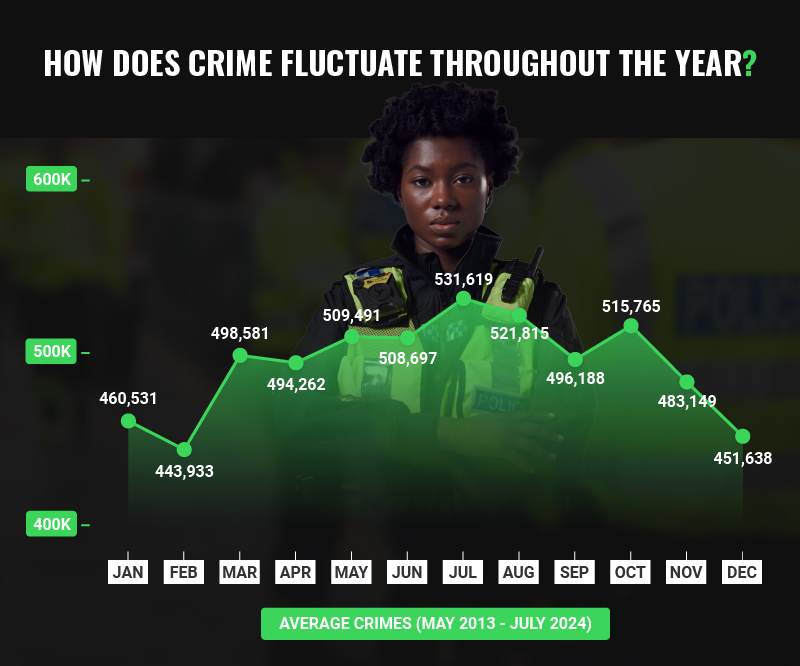
| Month | Average crimes (May 2013 - July 2024) |
|---|---|
| January | 460,531 |
| February | 443,933 |
| March | 498,581 |
| April | 494,262 |
| May | 509,491 |
| June | 508,697 |
| July | 531,619 |
| August | 521,815 |
| September | 496,188 |
| October | 515,765 |
| November | 483,149 |
| December | 451,638 |
Key Takeaways:
- July consistently takes the (unfortunate) crown as the month with the most crime, averaging 531,619 incidents. August isn’t far behind, with 521,815 crimes, suggesting that summer brings more than just sunshine—it also sees a rise in criminal activity.
- February is the quietest month for crime, with an average of 443,933 incidents. This could be due to the shorter month and chilly weather, which might discourage certain types of crime.
- Seasonal Patterns: There’s a clear trend where crime gradually increases from early spring, peaks in summer, and then dips again towards the end of the year. Warmer months, school holidays, and outdoor events may provide more opportunities for crime.
How Does Crime Fluctuate Throughout Type?
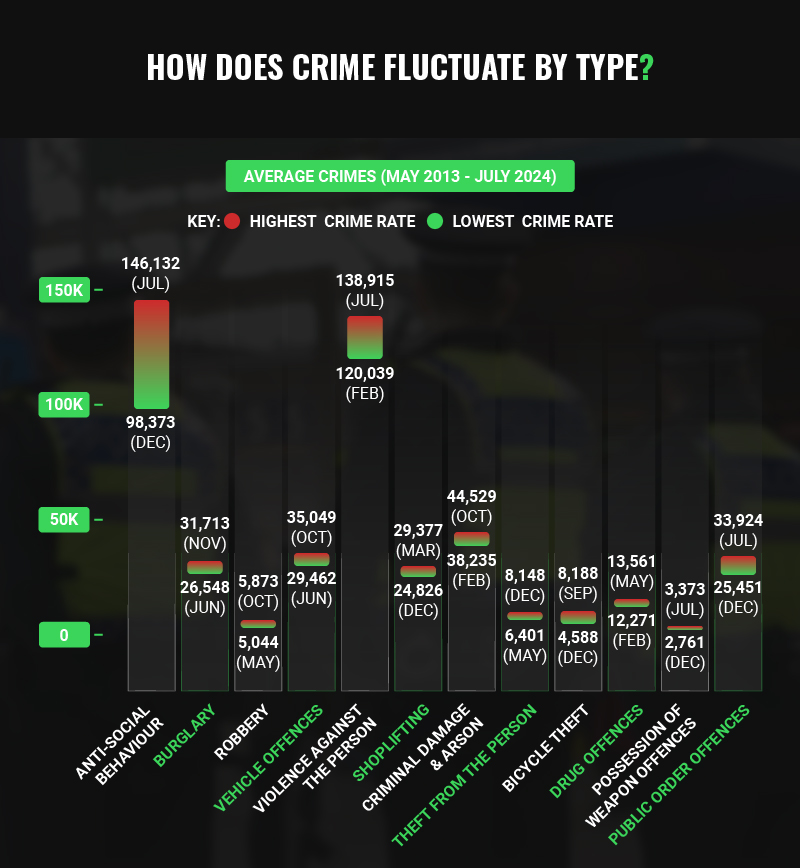
Different types of crime peak at different times of the year. Here’s a breakdown:
Anti-social Behaviour
- Peak: July (146,132 incidents)
- Lowest: December (98,373 incidents)
Anti-social behaviour is higher in the warmer months, possibly due to more outdoor gatherings and events. This seasonal increase suggests that more visible security and community patrols in summer could help keep incidents in check.
Burglary
- Peak: November (31,713) and January (30,893)
- Lowest: April (26,634) and June (26,548)
Longer nights in winter may give burglars more opportunities, while brighter spring and summer days seem to reduce these incidents. The increased activity around the holiday season could also contribute to the winter peak, as homes are often left unoccupied.
Robbery
- Peak: October (5,873)
- Lowest: April (5,054) and May (5,044)
Robbery stays fairly consistent, though there’s a slight uptick in October, perhaps due to increased night-time activity in autumn. This increase could also coincide with the start of shorter days, providing more cover for these offences.
Vehicle Offences
- Peak: October (35,049)
- Lowest: June (29,462) and July (29,806)
Vehicle-related crime sees a peak in autumn. Warmer months have slightly lower rates, though the difference is minor. The autumn increase may be due to longer hours of darkness and less visibility for vehicles parked outdoors.
Violence Against the Person
- Peak: July (138,915)
- Lowest: February (120,039)
Violence peaks in the summer, likely due to more people socialising outdoors. Alcohol consumption at outdoor events and festivals during these months may also contribute to the rise in violent incidents.
Shoplifting
- Peak: March (29,377) and October (28,363)
- Lowest: December (24,826)
Shoplifting is relatively stable, though December’s drop may be due to increased security around Christmas. Retailers often implement additional security measures and surveillance during the holiday shopping season, which could discourage shoplifters.
Criminal Damage & Arson
- Peak: October (44,529) and August (43,513)
- Lowest: February (38,235)
These crimes see a rise in late summer and early autumn but dip in colder months. The peak in October may also be linked to Halloween-related mischief or ‘mischief night’ traditions in some areas.
Theft From The Person
- Peak: December (8,148)
- Lowest: May (6,401) and June (6,502)
Theft from individuals is highest in December, possibly linked to busy shopping areas during Christmas. Increased crowds in stores and markets can make it easier for pickpockets to operate undetected.
Bicycle Theft
- Peak: September (8,188) and October (8,163)
- Lowest: December (4,588)
Bicycle theft peaks in autumn, while winter sees lower rates—likely because fewer people cycle in colder weather. Many people also store their bikes indoors during winter, which reduces opportunities for theft.
Drug Offences
- Peak: May (13,561)
- Lowest: February (12,271)
Drug-related crimes are steady throughout the year, with only a slight peak in May and a dip in February. Unlike other crime types, seasonal factors don’t seem to have much influence here, as drug use and distribution tend to be year-round activities.
Possession of Weapon Offences
- Peak: July (3,373) and March (3,348)
- Lowest: December (2,761)
Possession of weapon offences remains fairly consistent throughout the year, with small spikes in March and July. December sees the lowest numbers, which may reflect fewer public gatherings and events during colder months.
Public Order Offences
- Peak: July (33,924)
- Lowest: December (25,451)
Public order offences rise significantly in the summer, peaking in July. This trend mirrors the increase in anti-social behaviour and violence during warmer months when people are more likely to gather outdoors. December, on the other hand, is the quietest month, likely due to the colder weather and more indoor activities.
Crime Hotspots by Region
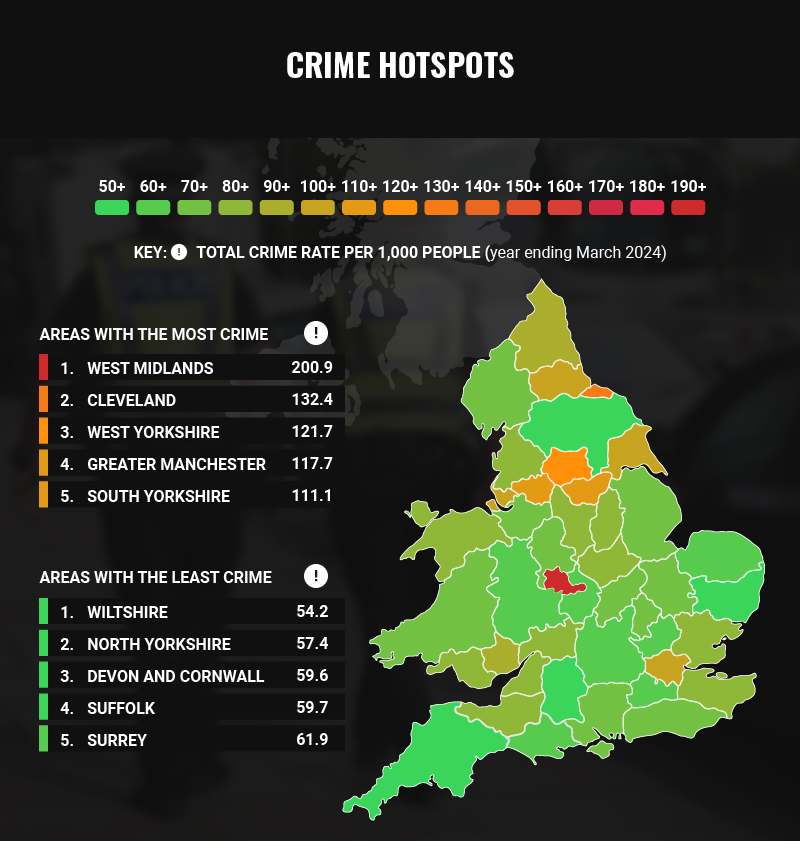
Crime rates also vary significantly depending on where you are in England and Wales. Generally, dense urban areas see higher crime rates, while rural areas report fewer incidents.
Top Crime Regions:
The West Midlands has the highest crime rate, with 200.9 incidents per 1,000 people. Cities like Birmingham, Coventry, and Wolverhampton are major urban hubs where crime tends to be higher.
Other High-Crime Regions include:
- Cleveland: 132.4 per 1,000 people
- West Yorkshire: 121.7
- Greater Manchester: 117.7
- South Yorkshire: 111.1
Lowest Crime Regions:
Wiltshire (54.2 per 1,000 people) and North Yorkshire (57.4) have the lowest rates. These areas are more rural, with smaller populations and fewer opportunities
for crime.
Crime Hotspots by Type
Certain regions stand out for specific crime types:
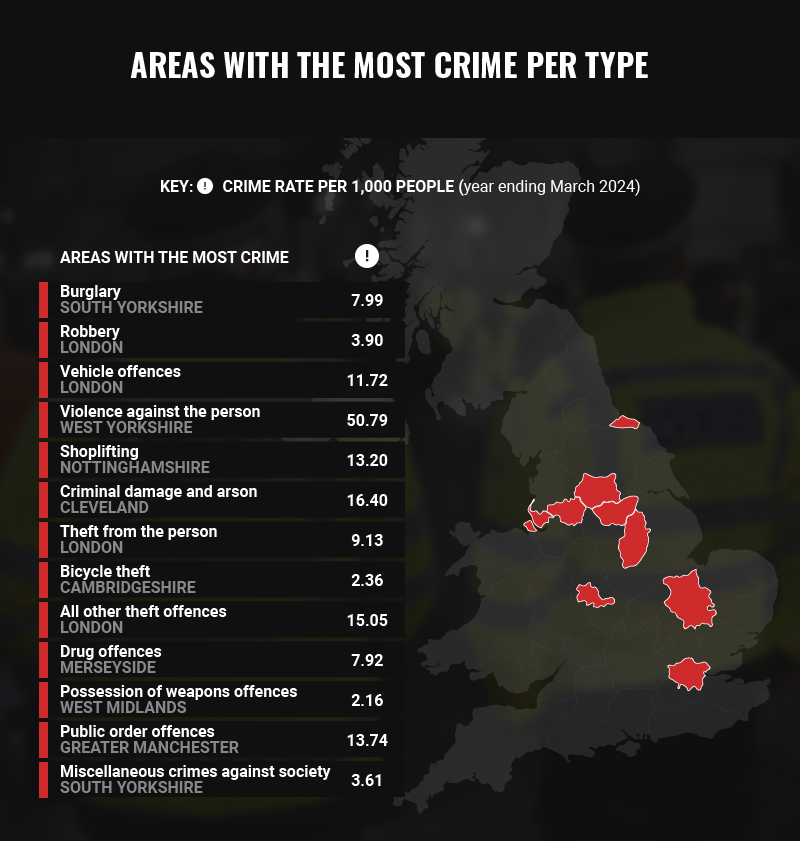
- London: Leads in robbery (3.9 per 1,000), vehicle offences (11.72), and theft from the person (9.13). The city’s dense population and income inequality likely contribute to these figures.
- South Yorkshire: Highest rates for burglary (7.99) and miscellaneous crimes against society (3.61), particularly in cities like Sheffield.
- West Yorkshire: Has the highest rate of violence against the person, with 50.79 incidents per 1,000 people. Economic challenges in parts of Leeds and Bradford may play a role here.
Low Crime Regions
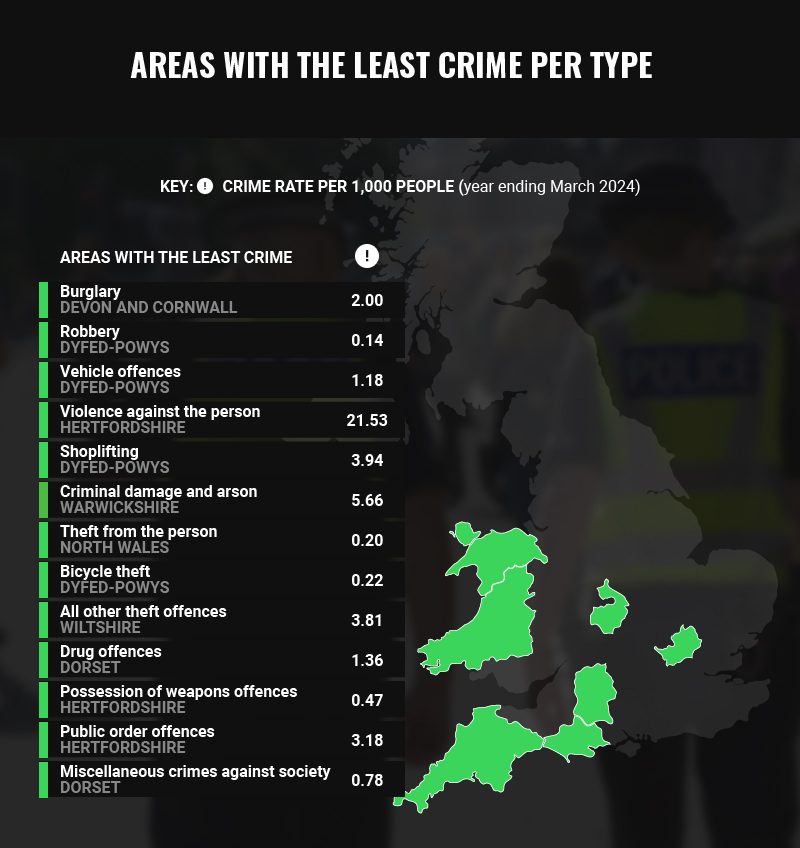
- Areas like Wales and the South West—especially Dyfed-Powys and Devon and Cornwall—show low crime rates for most categories. These rural regions tend to be quieter, with less population density and fewer major urban centres.
The Role of Security Licensing in Public Safety
Security licensing plays a crucial role in keeping the public safe by ensuring that trained, certified professionals are on hand to help deter crime. From door supervisors who manage access at venues to security guards who patrol public spaces, SIA licensed security professionals help maintain order and prevent incidents before they escalate.
At Get Licensed, we’re committed to empowering individuals with the skills and certifications they need to make a difference. Our SIA Door Supervisor Training course is designed for those starting their careers in security. It covers essential skills such as conflict management, crowd control, and emergency response, ensuring that new security personnel are fully prepared to handle high-pressure situations and keep the public safe.
For those already working in the industry, our SIA Door Supervisor Refresher Training keeps skills sharp and up-to-date. This course focuses on the latest safety protocols, legal updates, and advanced techniques in managing public safety, helping experienced professionals stay current and effective.
By offering top-quality training, Get Licensed ensures that security personnel are fully prepared to meet the demands of their roles, creating safer communities for everyone.
Methodology
Our analysis is based on data from two primary sources:
- Monthly Crime Data: Collected from UKCrimeStats, covering averages for each month between May 2013 and July 2024. This data allows us to identify seasonal and monthly trends across different crime types.
- Regional Crime Rates: Sourced from the Office for National Statistics’ Police Force Area data tables (March 2024). This includes crime rates by police force area and specific crime types. For London, we’ve included data from both the City of London and the Metropolitan Police forces.
Final Thoughts
Crime trends in England and Wales show interesting patterns, with higher crime rates in the summer and in urban areas. SIA Security licensing plays a key role here, ensuring that trained professionals are in place to help maintain public safety and deter crime.
Whether you’re a security professional, a business owner, or just someone curious about crime trends, understanding when and where crime peaks can be valuable. By staying informed, we can all play a part in making our communities safer.
Launch your career as a
Security Guard in the UK
Learn how to start your career in UK security industry.
Explore Courses

 Trustpilot


